
Fassen Sie diesen Blogbeitrag wie folgt zusammen:
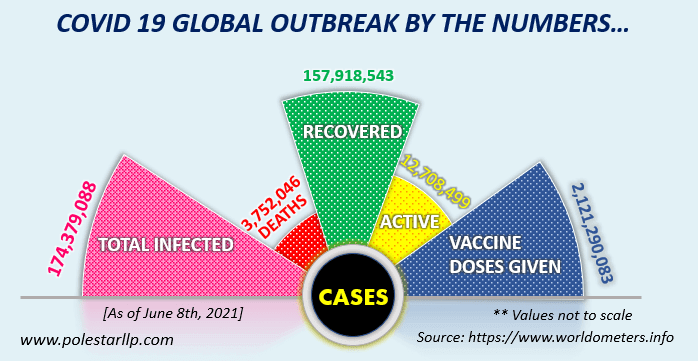
Während das Coronavirus mehr als 159 Länder erreicht hat, die weltweiten Fälle 174.379.088 übersteigen und die Zahl der Todesopfer 37 Lakhs (Stand: 7. Juni 2021) übersteigt, tut die ganze Welt ihr Bestes, um das Virus einzudämmen.
„Die Weltgesundheitsorganisation hat den Coronavirus-Ausbruch zu einer globalen Notlage erklärt. Hier erfahren Sie, wie Öffentlichkeit und Regierungen mithilfe von Analysetools die Ausbreitung des Virus verfolgen.“
Die Weltgesundheitsorganisation (WHO) und die US-amerikanischen Zentren für Krankheitskontrolle und -prävention (CDC) verfolgen den Ausbruch einer Krankheit, die sich zu einer weltweiten Epidemie ausweiten könnte. Sie begann in China, hat sich aber mittlerweile in viele Länder der Welt verbreitet. Die WHO erklärte den Coronavirus-Ausbruch am 30. Januar 2020 zu einer globalen Gesundheitsnotlage.
Heute erleben wir einen wichtigen Anwendungsfall für Analysen, der es in die Schlagzeilen schafft. Es ist einer jener Fälle, in denen Leben von Technologie abhängen.
1. Visualisierung globaler Fälle
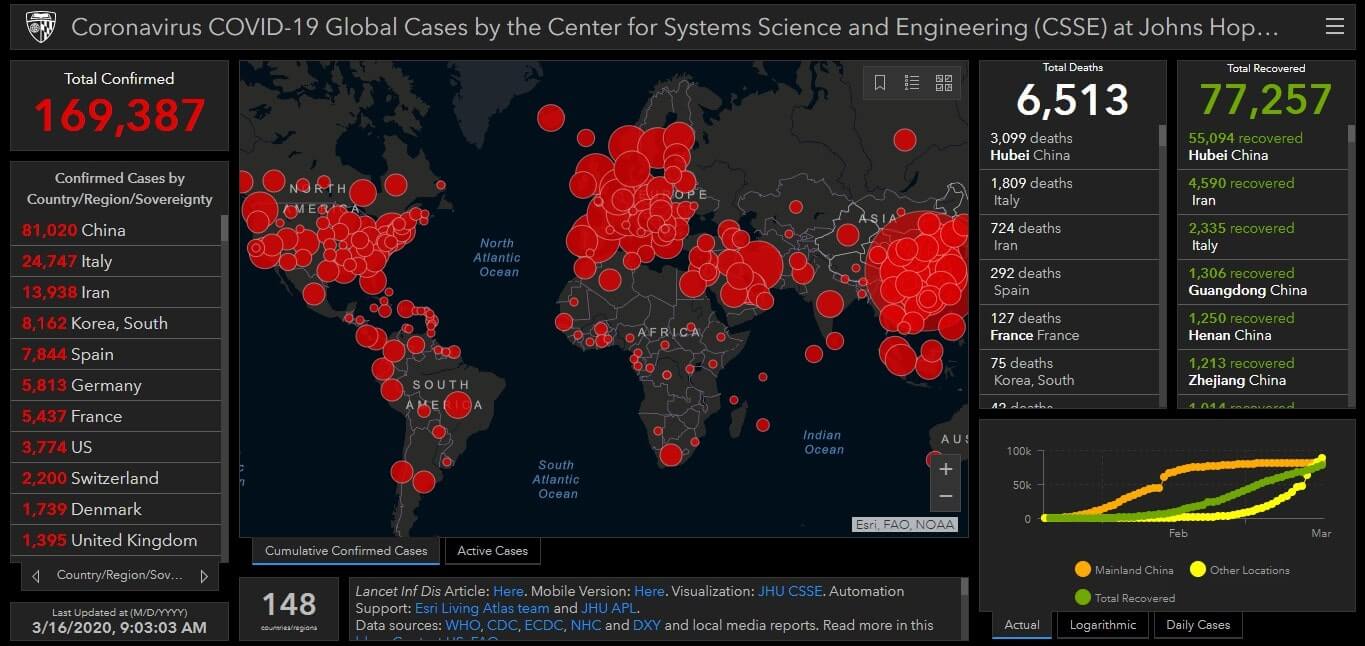
Das Center for Systems Science and Engineering der Johns Hopkins University hat ein Echtzeit-Visualisierungs-Dashboard für den Ausbruch entwickelt, das unter anderem folgende Informationen enthält: Auflistungen der Gesamtzahl der Fälle, Karten, Todesfälle, aktive Patienten, abgeschlossene und genesene Fälle.
Die Statistiken sind nach Ländern und Fällen aufgeschlüsselt, die auf der Karte durch die Größe der Punkte dargestellt werden. Zu den zitierten Quellen gehören unter anderem die CDC und die WHO. Die Universität nutzt Esris ArcGIS (Geografisches Informationssystem) für die Visualisierung, die online veröffentlicht wird. Das Dashboard bietet der Öffentlichkeit und Ärzten eine hilfreiche Möglichkeit, den Stand des Ausbruchs zu verfolgen. Darüber hinaus können die Nutzer nachvollziehen, wie die CDC und andere Regierungsbehörden die Daten analysieren.
Theresa Do, Professorin für Epidemiologie und Biostatistik an der George Washington University und SAS-Analytics-Managerin für Infektionsepidemiologie und Biostatistik, erklärt, dass Daten, Analysen, KI und andere Technologien eine wichtige Rolle dabei spielen, die Ausbreitung und den Verlauf von Krankheiten zu verstehen, zu identifizieren und vorherzusagen. Sie weiß, wie Organisationen Daten und Analysen nutzen, um die richtigen Entscheidungen zu treffen.
2. Live-Aktualisierung der Bettenverfügbarkeit
Wir haben gesehen, dass das Krisenmanagementmodell von Mumbai allseits Anerkennung gefunden hat. Ein zentraler Aspekt dieser Informationsweiterleitung ist die übersichtliche Darstellung von Informationen wie der Bettenverfügbarkeit in Echtzeit, sodass Ärzte und Behörden unverzüglich entsprechende Maßnahmen ergreifen können. So zeigt sich, wie Analysen nicht nur vergangene, sondern auch aktuelle Daten auswerten, um einen reibungslosen Informationsfluss zu gewährleisten.
Wie Big Data im Kampf gegen Krebs hilft
Die medizinische Analyse zur Vorhersage von Krebsrezidiven, Krankheitsverlauf und Therapieansprechen schreitet mithilfe von Big Data voran.
3. Geodatenanalyse
Analysen helfen Ärzten mithilfe geografischer Daten, Infektionsherde zu identifizieren. Beispielsweise werden Verdachtsfälle von Ärzten untersucht und anschließend zur Bestätigung an die CDC weitergeleitet. KI- und ML-Technologien unterstützen Ärzte und Behörden zudem dabei, bestätigte Fälle nachzuverfolgen und Informationen zu ihren Reisezielen und Kontaktpersonen zu gewinnen, um die weitere Ausbreitung vorherzusagen. Analysen mit künstlicher Intelligenz und maschinellem Lernen können Organisationen in diesem Ausbruch helfen, aus vergangenen Ereignissen zu lernen und aus Millionen von Datenpunkten schnell neue Erkenntnisse zu gewinnen.
Ebenso können sich Organisationen auch dafür entscheidensyndromische ÜberwachungDies hilft, Ausmaß, Ausbreitung und Tempo von Ausbrüchen zu erfassen, Krankheitstrends zu überwachen und die Gewissheit zu geben, dass kein Ausbruch stattgefunden hat. Soziale Medien dienen dabei oft als Frühwarnsystem. Zukünftig könnten Technologien wie Smartwatches eine entscheidende Rolle spielen, da sie Schlaf und Herzfrequenz erfassen und so frühzeitig auf gesundheitliche Probleme hinweisen können.
4. API-Nutzung
Soziale Medien werden in diesem Ausbruch häufig als Frühwarnsystem genutzt. In letzter Zeit sind neue Websites aufgetaucht, die Twitter-Daten zur Bettenverfügbarkeit anzeigen. Diese einfache Informationsbereitstellung wird durch die Nutzung von APIs ermöglicht. Auch Websites, die die Verfügbarkeit von Impfstoffen anzeigen, bieten Benachrichtigungen von Drittanbieter-Apps über die Impfstoffverfügbarkeit mit CoWin.
5. Prädiktive Analysen
Prädiktive Analysen lassen sich auch auf Daten von Flughäfen, Krankenhäusern und anderen öffentlichen Orten anwenden, um die Ausbreitung und das Risiko von Krankheiten vorherzusagen. Krankenhäuser können diese Daten nutzen, um die Auswirkungen eines Ausbruchs auf ihren Betrieb zu planen.
Zukünftig könnten Technologien wie Smartwatches eine entscheidende Rolle spielen, da Daten Schlaf und Herzfrequenz erfassen können, um frühzeitig Hinweise darauf zu geben, dass es einer Person nicht gut geht.
Die wichtigste Lehre für die IT aus dem Ausbruch ist, dassDatenanalysenim Kampf gegen Covid-19 eine entscheidende Rolle spielen und sich zu einer Grundlage für alle Arten von Organisationen und Abläufen entwickelt haben. Zwar werden Analysen und maschinelles Lernen nicht direkt in Arztpraxen eingesetzt, um Proben für Tests zu entnehmen, doch tragen diese Technologien dazu bei, die Gesamtbemühungen zu unterstützen und Ärzte sowieGesundheitseinrichtungeneffizienter und besser für die Bekämpfung der Ausbreitung eines virusähnlichen Coronavirus auszurüsten.