
Summarize this blog post with:
| A working capital dashboard unifies receivables, payables, and inventory, tracks key cash metrics, reveals performance drivers, and enables timely action before issues escalate. |
TL;DR
- €1.84 trillion sits idle across global listed companies, per PwC's Working Capital Study 25/26, because dashboards flag movement long after the cash has left.
- The metrics that actually matter are DSO, DPO, DIO, CCC, liquidity coverage, and free cash flow, each with a trend and a benchmark.
- Mature working capital management software moves across four layers: visibility, diagnosis, simulation, and execution. Most tools stall at layer one.
- Polestar Analytics' CapitalPulse operationalizes all four, with an Anaplan-validated scenario bridge and a tracked Action list.
€1.84 trillion is sitting idle on corporate balance sheets right now. PwC's Working Capital Study 25/26 traces that excess across more than 17,000 listed companies: cash that could fund reinvention or cut reliance on expensive financing, yet stays trapped because no one saw it move in time. Despite a decade of dashboards, that number has barely budged.
The reason is structural. A treasury team will see the DSO go up four days and know collections are falling behind, but the dashboard won't show them that three enterprise clients have gone net-60 terms until a manual reconstruction has been done a week later. This is long after the cash has left.
Finance leaders are aware of the gap. Deloitte's Finance Trends 2026 report, which polled more than 1,300 finance leaders, found that 30% are strengthening advanced scenario planning and 28% are building more agile governance models to speed up decision-making, both direct responses to the fact that traditional reporting is too slow for how quickly working capital now moves. Deloitte's Q4 2025 CFO Signals survey, released in January 2026, reinforces the point: 50% of North American CFOs name digital transformation of finance their top 2026 priority.
A good dashboard exists to shrink the distance between a metric moving and someone acting.
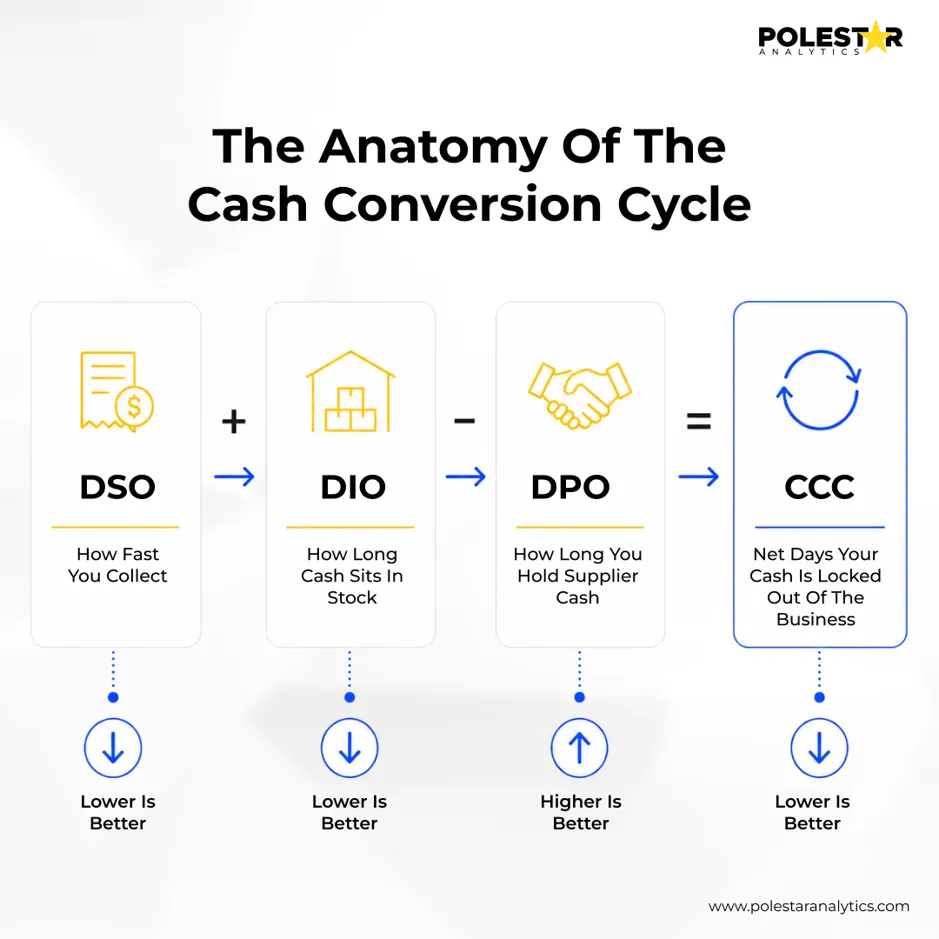
A working capital management system should elevate the ratios that drive decisions and push the rest into drill-downs; the right working capital management tool makes that hierarchy clear.
- Days Sales Outstanding (DSO): how quickly you convert sales into cash. Rising DSO signals collections friction, disputed invoices, or unilateral term shifts by customers.
- Days Payable Outstanding (DPO): how long you hold supplier cash. Compression often reveals an early-payment program quietly draining liquidity.
- Days Inventory Outstanding (DIO): value locked in stock, rising when procurement hedges supply risk or forecasting drifts from reality.
- Cash Conversion Cycle (CCC): DSO + DIO − DPO, the clearest read on how many days your cash is trapped in operations.
- Liquidity Coverage Ratio (LCR) and Free Cash Flow (FCF) translate the operational metrics into the treasury and covenant reality a board and a lender watch.
Pair each metric with a trend and a benchmark, which is what turns a number into a judgment: a DSO of 45 days means nothing until you know whether peers sit at 30 or 60, an approach the team behind financial analytics services builds in.
The metrics tell you what to watch. The next question is what a dashboard should actually do with them.
Most enterprise dashboards are rear-view mirrors dressed up as cockpits. They tell you the cash already left, not which five customers caused it or what liquidity looks like 90 days out if you act today.
The market is voting with its budgets. Deloitte's January 2026 CFO Signals survey found 87% of CFOs expect AI to be extremely or very important to finance in 2026, and 54% name AI-agent integration a transformation priority. Yet among organizations that have deployed AI, only about one in five report tangible value so far. That gap between deployment and impact is the whole game.
Polestar Analytics designed CapitalPulse around this shift, treating the dashboard as the entry point into a closed loop of detection, diagnosis, simulation, and execution.
To make the workflow concrete, consider a common Monday-morning scenario for an enterprise VP of Finance running the Polestar Analytics platform.
The scenario. DSO has drifted up roughly ten days over the past month. The liquidity coverage ratio is edging toward the 1.5x floor set by a bank covenant that will be tested in three weeks. Early-payment discounts are running above budget. On the surface, three separate problems.
On login, the Command Center presents a single executive read with each metric alongside its trend and benchmark, and a plain-language summary of what changed and why. The morning read is a briefing, not a wall of charts.
One click down, the Insights Engine has already connected the dots: five enterprise customers unilaterally shifted to net-60, a duplicate-invoice batch from a billing migration is blocking a chunk of collections, and an early-payment discount program is compressing DPO faster than it is pulling cash forward. What looked like three problems is one, with three drivers.
In the Scenario Builder, the team models a combined response: escalate collections on the five enterprise accounts, extend payment terms with a set of non-critical vendors, and hedge inventory against the underlying supply risk. Sliders on DSO target, discount rate, and vendors-on-extended-terms produce side-by-side projections for cash, DSO, DPO, and CCC, with covenant headroom recalculated in real time.
The preferred scenario is pushed through the Anaplan Bridge for full P&L and balance-sheet validation, so the treasurer isn't signing off on a working-capital plan that quietly breaks the operating model. This is why the Anaplan partnership matters: the dashboard doesn't bypass enterprise planning, it feeds it.
Accepted actions land in the Action Tracker with named owners across collections, treasury, and procurement, target dates, and projected versus realized cash impact. Nothing goes back to a slide deck to be forgotten. Throughout, the Genie AI Copilot answers ad-hoc questions in the user's own language, grounded in the company's data.
The point of the workflow isn't the modules. It is that a signal seen on Monday morning becomes an owned, tracked, financially validated action by end of week, instead of a topic for the next quarterly review.
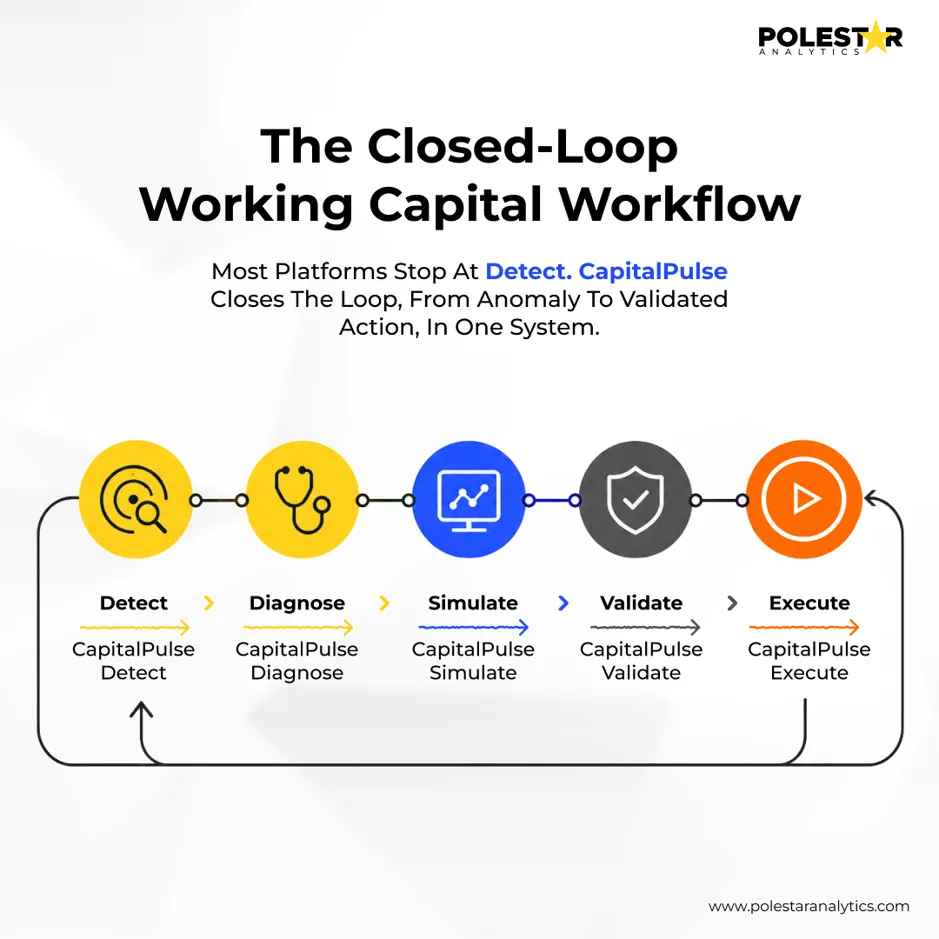
Score any working capital dashboard against four progressive layers; most tools stall at the first.
- Layer 1, Visibility. Does it consolidate AR, AP, and inventory into unified, real-time metrics with benchmarks? Table stakes, and where BI dashboards stop.
- Layer 2, Diagnosis. Does it consolidate AR, AP, and inventory into unified, real-time metrics with benchmarks? Explore how working capital analytics improves inventory performance. Table stakes, and where BI dashboards stop.
- Layer 3, Simulation. Can you model a strategy and see its projected impact on cash and CCC before committing capital?
- Layer 4, Execution. Does an insight become a tracked, owned action with measurable follow-through?
A tool that reaches only Layer 1 is a report; a solution spanning all four is a decision engine. It is the fastest way to separate the best working capital management software from repackaged reporting, and to compare working capital management solutions on the axis that matters.
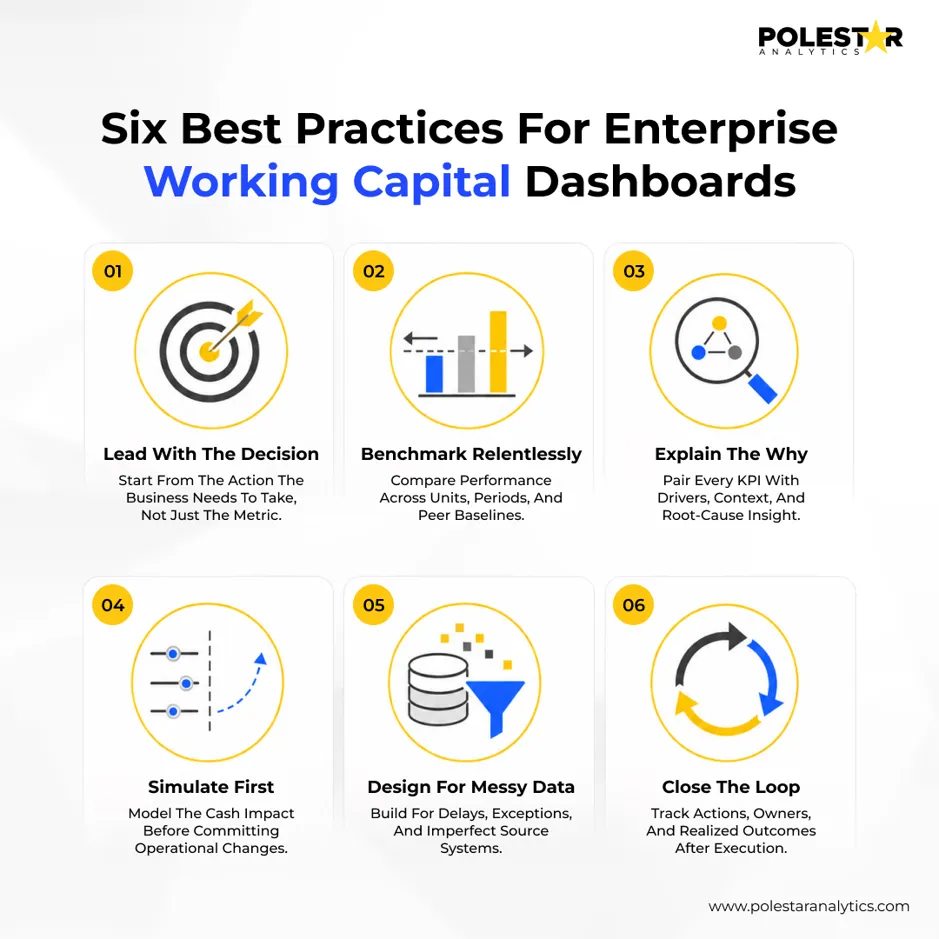
- Lead with the decision, not the data. Open on what needs attention today, not a wall of charts.
- Benchmark relentlessly. Numbers without internal or peer benchmarks invite complacency.
- Explain the "why" automatically. If a human must reverse-engineer the driver behind a DSO spike, the dashboard has failed.
- Simulate before you commit. Scenario modeling lets you test competing working capital strategies and makes the cost of straining a supplier or over-discounting explicit before it lands.
- Design for messy data. A practical solution ingests fragmented ERP, AP, inventory, and Excel data as-is, not a pristine gold layer.
- Close the loop. Traceability from detection to execution is what makes working capital management strategies stick.
These practices echo the 1Platform ecosystem and the governance-first thinking on prioritizing AI spend in 2026.
This link is mechanical, not rhetorical. Every day off the cash conversion cycle releases cash that no longer has to be financed. For a business turning over $1.8 billion a year, each cycle-day ties up about $5 million; trimming ten days frees roughly $50 million, and at an 8% cost of capital avoids about $4 million in annual financing cost, lifting return on invested capital.
Gartner's April 2026 analysis projects that by 2029, CFOs who deploy AI strategically, not in isolated pilots, will unlock an additional 10 points of margin growth, with three-quarters raising tech budgets for 2026. That finding is about AI broadly, not working capital, but the logic converges: margin gains come from AI applied where it reinforces core value drivers, and working capital is one of the clearest. A dashboard that reaches the execution layer is what separates modern working capital solutions from static working capital tools, the thesis behind the Polestar Analytics Pulse Suite, of which CapitalPulse is the working capital pillar.
A BI dashboard displays data; a working capital dashboard is developed for making cash decisions. A working capital management solution adds finance-native intelligence: it explains why a metric shifted, connecting it to specific customers, vendors, or SKUs, then lets you simulate a fix and track it.
DSO, DPO, DIO, and the cash conversion cycle that ties them together, plus liquidity coverage ratio and free cash flow for treasury and covenant visibility, each with a trend and a benchmark. Advanced working capital management software layers predictive signals on top, so teams act on leading indicators, not lagging ones.
Yes. Enterprise data typically lives across ERPs, AP platforms like Ariba or Coupa, inventory systems, and spreadsheets. The most practical working capital management software ingests real-world data as-is, cleansing and harmonizing it automatically. CapitalPulse turns fragmented, multi-source finance data into decision-ready intelligence, with manual Excel-template ingestion for smaller organizations.
Directly, through the cash conversion cycle: every day removed releases cash that no longer needs external financing, which in an elevated-rate environment cuts interest expense and lifts return on invested capital. Effective working capital management strategies convert a balance-sheet inefficiency into recurring margin.
Software alone rarely moves the number. A capable working capital management firm pairs the platform with domain expertise: benchmarks, root-cause analytics, scenario modeling validated against planning models, and change management across finance, procurement, and treasury. Polestar Analytics combines CapitalPulse with financial analytics and Anaplan planning expertise, connecting operational drivers to validated financial outcomes.
- Working capital is a profitability lever, not a back-office metric. PwC's 2026 study puts €1.84 trillion in excess working capital across global listed companies.
- Most dashboards stop at visibility. The value is in diagnosis, simulation, and execution.
- Track the vital few: DSO, DPO, DIO, CCC, liquidity coverage, and free cash flow, each with a trend and a benchmark.
- AI is central to the finance agenda. 87% of CFOs call it extremely or very important for 2026 (Deloitte), but value comes from closing the loop between insight and action. Explore the best working capital management platforms for CFOs to understand the solutions supporting this shift.
- CapitalPulse spans all four layers, from Command Center visibility through Anaplan-validated scenarios to a tracked Action list, positioning Polestar Analytics' working capital management software for enterprise finance teams.