
Summarize this blog post with:
| From signal quality to Agentic AI, see how demand forecasting and S&OP integration reshape autonomous planning, governance, and revenue growth management. |
Supply chain leaders spent a decade improving forecast accuracy by single digits. Then handed that forecast to an autonomous system and called it transformation.
The forecast error hasn't changed. What's changed is what's executing against it. According to studies , median forecast error in food and beverages sits around 25%. In durable consumer products, it reaches 50%. Now things get interesting when we enable agentic systems to make supply, pricing, and allocation decisions on top of that error — in real time, without a human review cycle to catch it first. Now that Gartner predicts, 50% of supply chain management solutions to embed intelligent agents by 2030. Think about the repercussions.
A biased forecast in a monthly S&OP cycle costs you a bad quarter. The same biased forecast feeding an autonomous agent costs you continuously — at machine speed.
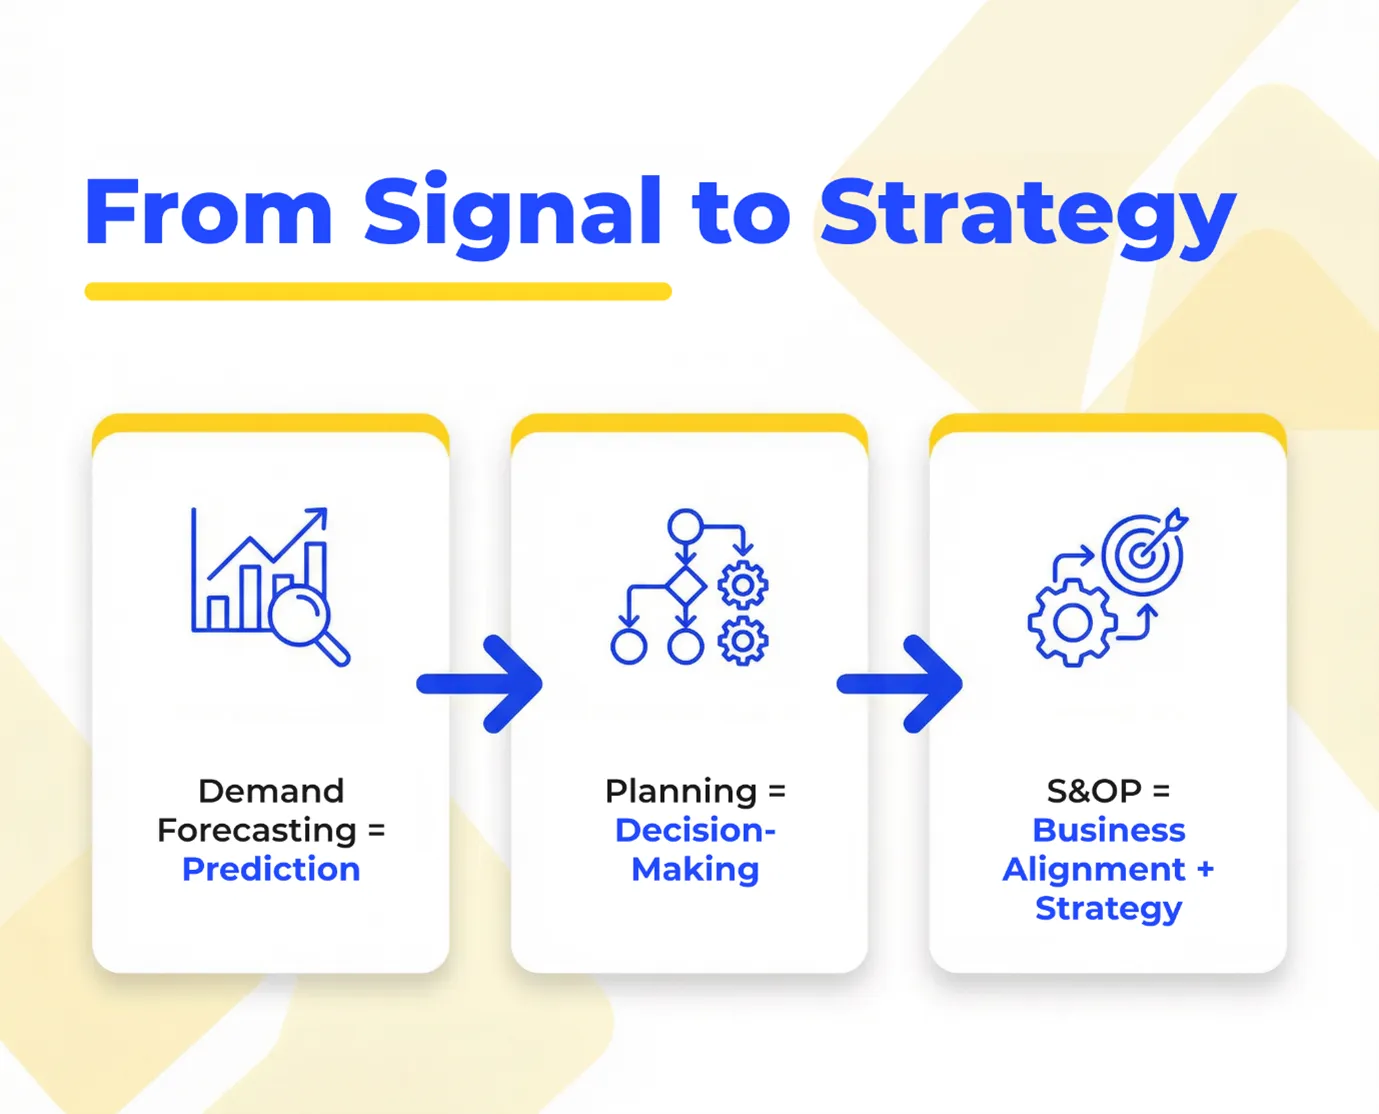
The error rate isn't the problem. It's a symptom. The organizations getting forecasting right aren't doing anything exotic — they're fixing the fundamentals in the right order. Signal quality before methodology. Methodology before integration. Integration before automation.
That sequence is what this piece maps.
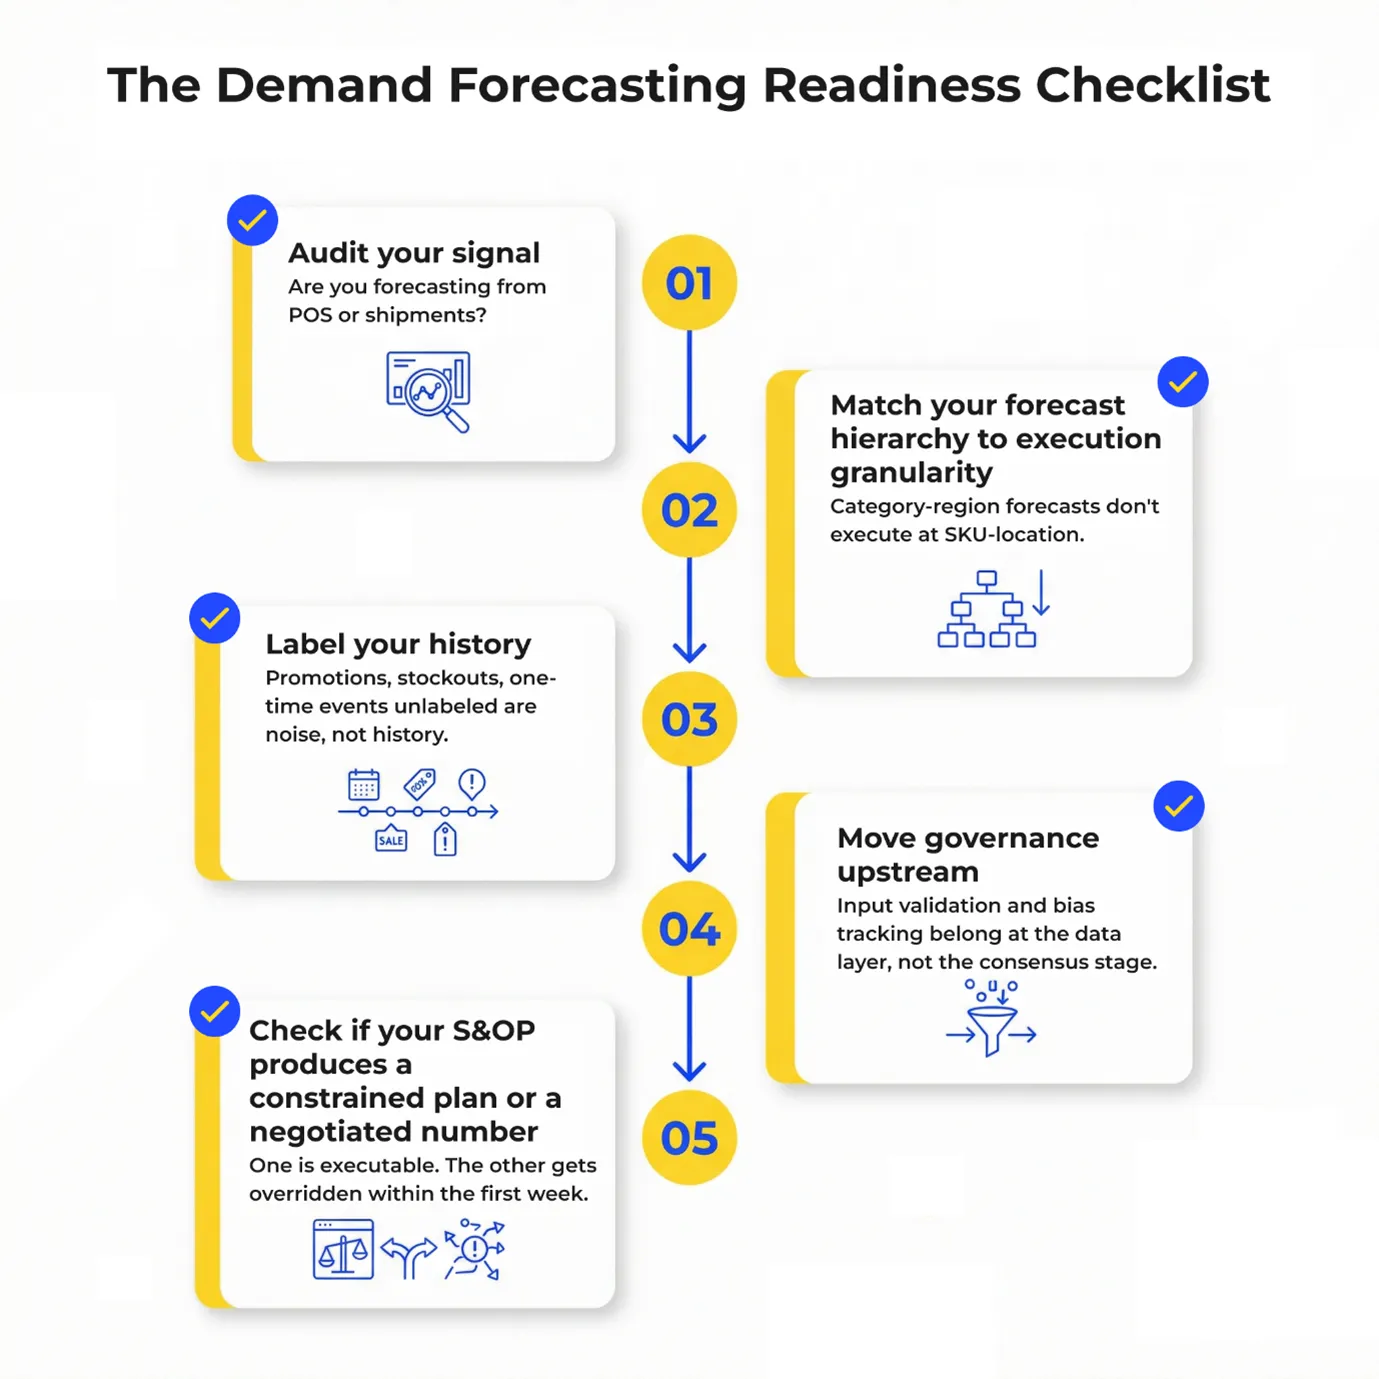
Before fixing the sequence, you need to understand what’s actually breaking it. Most forecasting failures aren’t methodology failures. They’re methodology mismatch failures i.e., the right technique applied to the wrong SKU, the wrong data, or the wrong planning horizon. And understanding where each break is more useful that debating which is better.
So, let’s start with that.
Two families of methods dominate modern demand forecasting.
FAMILY 1 - Statistical Methods (ARIMA, Exponential Smoothing, Holt-Winters)
Built for stability. Perform well on high-volume SKUs with 18+ months of clean demand history and low external driver dependency. Fast, transparent, explainable in an S&OP review. The right foundation for core portfolio baseline forecasting.
| Situation |
Recommended Method |
| Stable demand |
Moving Average / SES |
| Trend + Seasonality |
Holt-Winters |
| Strong autocorrelation |
ARIMA |
| Price & promo impact |
Regression / ARIMAX |
| Intermittent demand |
Croston (SBA) |
| Multi-level planning |
Hierarchical reconciliation |
They break on three specific conditions: promoted periods, new product introductions, and externally driven demand. And here's the contamination most teams miss — most organizations forecast from shipment data, not POS data. Shipments reflect what you decided to send. POS reflects what consumers decided to buy. Forecasting from shipments on a promoted SKU means your model is learning your own supply behavior, not the market's. The baseline looks smooth. The actual demand underneath it isn't.
FAMILY 2- ML-Based Models (Gradient Boosting, LSTM, Ensemble Frameworks)
Handle causal complexity that statistical methods can't. Non-linear interactions between price, promotion, competitor moves, and external signals are exactly their domain. But they carry a demanding data contract: sufficient volume at forecast granularity, clean event labeling across the training window, and stockout-corrected history — so the model doesn't mistake a supply failure for zero demand.
Deploy ML on thin or contaminated data and it doesn't fail obviously. It generates confident wrong predictions in directions that are harder to diagnose than a simple ARIMA miss. You've traded interpretable failure for opaque failure.
| Scenario |
ML Model |
| Tabular data + promotions |
XGBoost / LightGBM |
| Long sequential data |
LSTM / GRU |
| Many SKUs + probabilistic forecast |
DeepAR / TFT |
| High interpretability needed |
GBM + SHAP |
| Small dataset |
SVR |
The rule: Statistical baselines on stable SKUs with clean signals. ML where you have causal drivers, labeled promotional history, sufficient volume, and stockout-corrected data. Never use ML to compensate for data problems that should be solved upstream.
Delphi, salesforce composite, market research, expert judgment — these don't replace quantitative models. They calibrate them. For new product introductions, market entry scenarios, and demand shifts driven by intelligence your historical data hasn't captured yet, structured qualitative input fills the gap that statistical and ML methods can't. The key word is structured — unstructured opinion fed into a forecast without governance is how bias enters through the front door.
One more dimension cutting across all three — forecast hierarchy. Aggregate accuracy masks SKU-location failure. S&OP decisions execute at SKU-location: which distribution centre carries what volume, which production line runs which variant. That's where the forecast needs to be right — not at the level that looks good in a board presentation. And none of it matters if the inputs are fragmented, delayed, or uncleaned. The model can't tell the difference between a data quality problem and a demand signal. It learns from both.
Demand forecasting doesn't end when you generate a number. That's where it starts mattering.
The S&OP process is where forecasting either becomes coordinated action — or dies in a consensus meeting. When the forecasting foundation is clean, each stage has something real to work with. When it isn't, every stage downstream inherits and amplifies the error.
Here’s where forecasting directly impacts each S&OP stage:
| S&OP Stage |
Forecasting Input Required |
What Breaks Without It |
| Statistical Demand Review |
Clean baseline at SKU-region level. POS not shipments. |
Baseline inherits supply behavior not demand. Bias embeds silently. |
| Unconstrained Demand Plan |
Market-driven forecast independent of operational constraints. |
S&OP negotiates from the wrong starting point. Politics fills the data gap. |
| Consensus Demand Plan |
Cross-functional alignment on one number with override tracking. |
Overrides accumulate without feedback. Models learn nothing. Bias compounds. |
| Constrained Supply Plan |
Validated demand reconciled against capacity and inventory. |
Execution receives a plan divorced from operational reality. |
| Pre-S&OP Review |
Scenario-modelled demand variants with confidence intervals. |
Leadership makes trade-off decisions blind to forecast uncertainty. |
| Executive S&OP |
Financially reconciled demand plan with risk flags. |
Strategic decisions approved on consensus not probability. |
| S&OE Execution |
High-frequency demand sensing. Real-time signal vs plan deviation. |
Weekly execution flies blind between monthly cycles. Latency becomes loss. |
Get this right and the numbers follow. Organizations integrating demand forecasting with S&OP effectively report 15-20% improvement in forecast-plan alignment and 10-15% safety-stock reductions — working capital released directly back into operations.
Once you have the foundation right. Now add an agent to it and the picture changes.
The monthly S&OP cycle had one underappreciated feature: it was slow enough to catch its own mistakes. Good thing is Agentic systems aren’t.
Supply replenishment, pricing adjustments, and allocation decisions now execute autonomously — at frequency and scale no human review cycle can match.
The forecast error doesn't wait for the next monthly cycle. It compounds in real time. Which gives us three very specific shifts which define what it means for forecasting practice:
- Reconciliation cycles compress from weeks to hours
Agentic systems act on the current forecast signal without waiting for consensus. If that signal is contaminated — shipments not POS, unlabeled promotions, uncorrected stockouts — the agent executes confidently on bad intelligence. The reconciliation meeting that would have caught it no longer exists.
- Decision latency disappears — and so does the correction window
Planner latency was also thinking time — time to question the number, sense-check against market intelligence, override when something felt wrong. Autonomous execution eliminates that window. Forecast quality stops being a planning inconvenience and becomes an operational risk.
- Governance timing shifts upstream
In a manual process, governance happens at the consensus stage. With agentic systems, by the time a bad decision is visible it's already been made — likely hundreds of times. Governance has to move to forecast inputs and model monitoring, not decision outputs. You can't audit your way out of a structural signal problem.
McKinsey research confirms AI-driven forecasting reduces errors by 20-50% — but only where the underlying data infrastructure supports it. The performance gap between organizations that invest in signal quality first and those that deploy AI on contaminated data is widening. Fast.
Closing it starts with five questions.
When demand signals become agentic, forecasting no longer ends at supply planning; it becomes the trigger that synchronizes S&OP execution with Revenue Growth Management outcomes.
Most organizations stop at supply. The demand signal tells you what to make and where to stock it — the pricing, promotion, and margin decisions embedded in that same signal get made later, elsewhere, by a different team.
That lag has a cost. A forecast flags a spike in a promoted beverage SKU — confirmed retail activation, seasonal lift. Supply responds. Trade spend doesn't know yet. By the time the promotional decision surfaces, the window has narrowed. The forecast was right. The commercial response was late.
This is the gap between forecasting accuracy and forecasting value.
Closing it requires the demand signal and the commercial response to operate in the same S&OP cycle — not sequentially. Supply and revenue decisions made together, against the same signal, in the same planning window.
Agentic execution makes that possible. Rather than routing forecasts through sequential pricing, promotion, and trade workflows, agentic systems recalibrate promotional depth, reallocate trade investment, and enforce margin guardrails in real time — feeding S&OP with an executable revenue plan, not a number to negotiate around.
That's where Profit Pulse, Polestar Analytics' agentic RGM suite on 1Platform, operates — converting forecast precision into synchronized supply and commercial action, with quantified uplift and controlled downside risk built in.
The forecast stops being a planning input. It becomes the trigger for a coordinated RGM decision.
Forecasting is the brain. Pricing is the heart. Profit Pulse keeps both beating
Let’s bring agentic RGM to life.
The organizations getting there first aren't doing it by deploying better technology on broken foundations. They're doing it by fixing signal quality, matching methodology to data reality, and integrating forecasting into every S&OP stage before automation enters the picture.
That's the sequence. And it's precisely where Polestar Analytics operates — from cleaning the demand signal and building the S&OP architecture that makes it actionable, to deploying agentic RGM through Profit Pulse on 1Platform so that forecast precision translates directly into revenue decisions.
The foundation is the advantage. Everything else scales on top of it