


 Ali kidwaiInnehållsarkitekt
Registrera dig för att få de senaste insikterna och uppdateringarna inom teknik, AI och dataanalys, datavetenskap och innovationer från Polestar Analytics.
 Sammanfatta detta blogginlägg med:
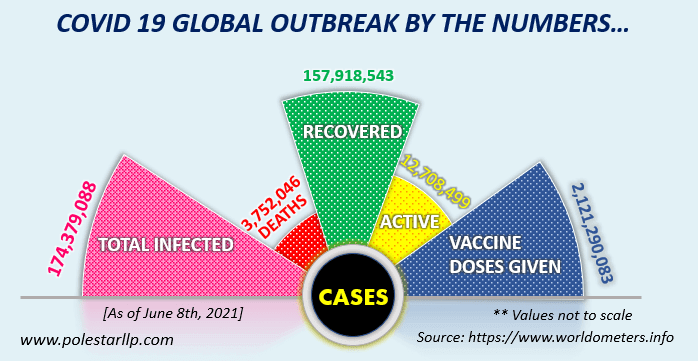
I takt med att coronaviruset når fler än 159 länder med globala fall som överstiger 174 379 088 och antalet dödsfall som överstiger 37 lakhs (per den 7 juni 2021), gör hela världen sitt bästa för att mildra virusets spridning.
”Världshälsoorganisationen har förklarat coronaviruset som en global nödsituation. Så här använder allmänheten och regeringar analyser för att spåra utbrottet.”
Världshälsoorganisationen (WHO) och det amerikanska smittskyddsorganet Center for Disease Control följer utbrottet av vad som kan bli en världsomspännande epidemi. Det började i Kina, men har spridit sig till många länder över hela världen. WHO förklarade coronavirusutbrottet som en global hälsokris den 30 januari 2020.
Idag ser vi ett stort användningsområde för analys som hamnar i rubrikerna. Det är ett av de fall där liv är beroende av teknik.
1. Visualization of Global Cases
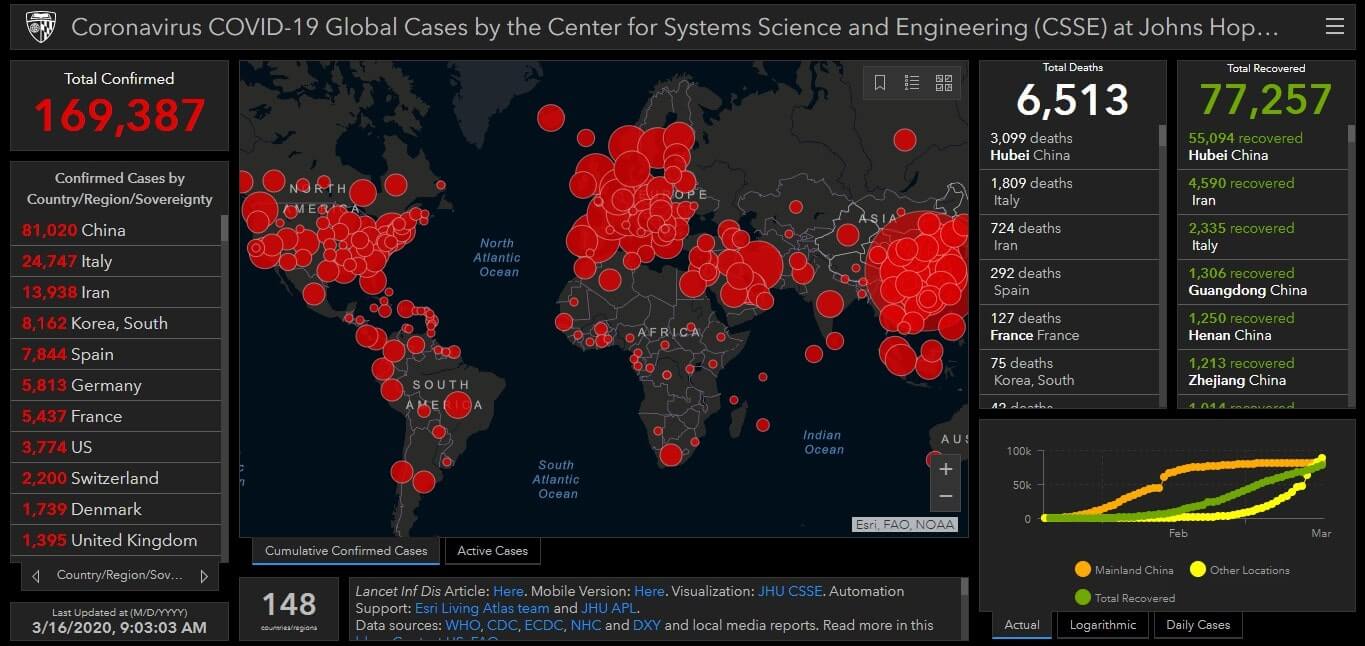
The Johns Hopkins University’s Center for Systems Science and Engineering has built a real-time visualization dashboard of the outbreak that includes – listings of total numbers of cases, maps, deaths, active patients, closed, and recovered cases.
The statistics are further broken down by countries and cases represented on the map by the size of the dot. The quoted sources include – CDC, WHO, and more. The university is using Esri’s ArcGIS (Geographic information system) for the visualization, which is published through the web. The dashboard is a beneficial way for the general public and doctors to track the status of the outbreak. And from this, people can also know how the CDC and other government agencies are analyzing the data.
According to, Theresa Do, professor of epidemiology and biostatistics at George Washington University and SAS analytics manager for infectious diseases epidemiology and biostatistics, says data, analytics, AI and other technology have a significant role to play in helping to understand, identify, and assist in predicting disease spread and progression. She knows how organizations use the data and analytics to make the right decisions.
2. Live-updates of Bed availability
We have seen that the Mumbai model of handling the crisis has been applauded by everyone. One of the key areas of such information relay is the dashboarding of the information like the availability of beds in a real-time basis such that doctors, physicians as well the government authorities can take relevant actions without delay. As such we can see how analytics is not only helping to analyze the past data but also the present data to ensure free flow of information.
Medical analysis to predict cancer recurrence, progression and response to therapy is advancing with the help of Big Data
3. GeoSpatial Analytics
Analytics has been helping doctors in identifying the hot-spots with the help of geographical data. For example – The suspected new cases would be tackled by physicians and then sent to the CDC for confirmation. AI and ML technologies will also help doctors and government agencies to track down the confirmed cases and come out with the information like – where they’ve traveled and who they came in contact with, to predict the spread. So, analytics that include Artificial Intelligence and Machine Learning can help organizations in this outbreak to learn from past events to create new knowledge swiftly from millions of data points.
Likewise, organizations can also go for syndromic surveillance which helps to track down the size, spread, and tempo of outbreaks, to monitor disease trends, and to provide reassurance that an outbreak has not occurred. Social media is often used as a sentinel source in this outbreak. In the future, technologies like smartwatches may play a crucial role, as data can track sleep and heart rates to provide early indications that a person is not doing well.
4. API Usage
Social media is often used as a sentinel source in this outbreak. In the recent past we have seen new websites showing the data of twitter for bed availability. Such ease of information is made possible by the use of API. Even websites that show availability of vaccines now, think of notification by 3rd party apps regarding availability of vaccines with CoWin.
5. Predictive analytics
Predictive analytics can also be applied to data from – airports, hospitals, and other public places to predict disease spread and risk. Hospitals can use the data to plan for the impact of an outbreak in their operations.
In the future, technologies like smartwatches may play a crucial role, as data can track sleep and heart rates to provide early indications that a person is not doing well.
Den viktigaste lärdomen för IT under utbrottet är attdataanalyshar bidragit till att bekämpa covid-19 och har utvecklats till att vara en grundpelare för alla typer av organisationer och verksamheter. Även om analys och maskininlärning inte sitter på lokala läkarmottagningar och tar prover för testning, används dessa tekniker för att underlätta den övergripande insatsen och göra läkare ochvårdorganisationermer effektiva och bättre rustade för att bekämpa spridningen av ett virusliknande coronavirus.
Om författaren
Innehållsarkitekt
Målet är att omvandla data till information, och information till insikter.
Relaterad blogg
 Aishwarya Saran
 Nitin Kumar